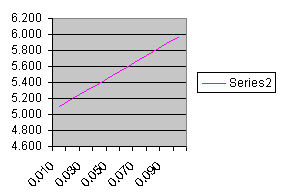
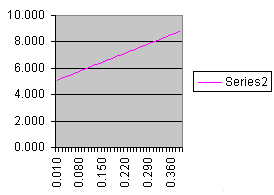
CHART Create a chart: Iterations - change number of data
The user can change number of data.
Create a chart: Iterations - change number of data, steps:
Iteracije Index