abc MICROSOFT EXCEL 2010 - CHART - Examples in physics
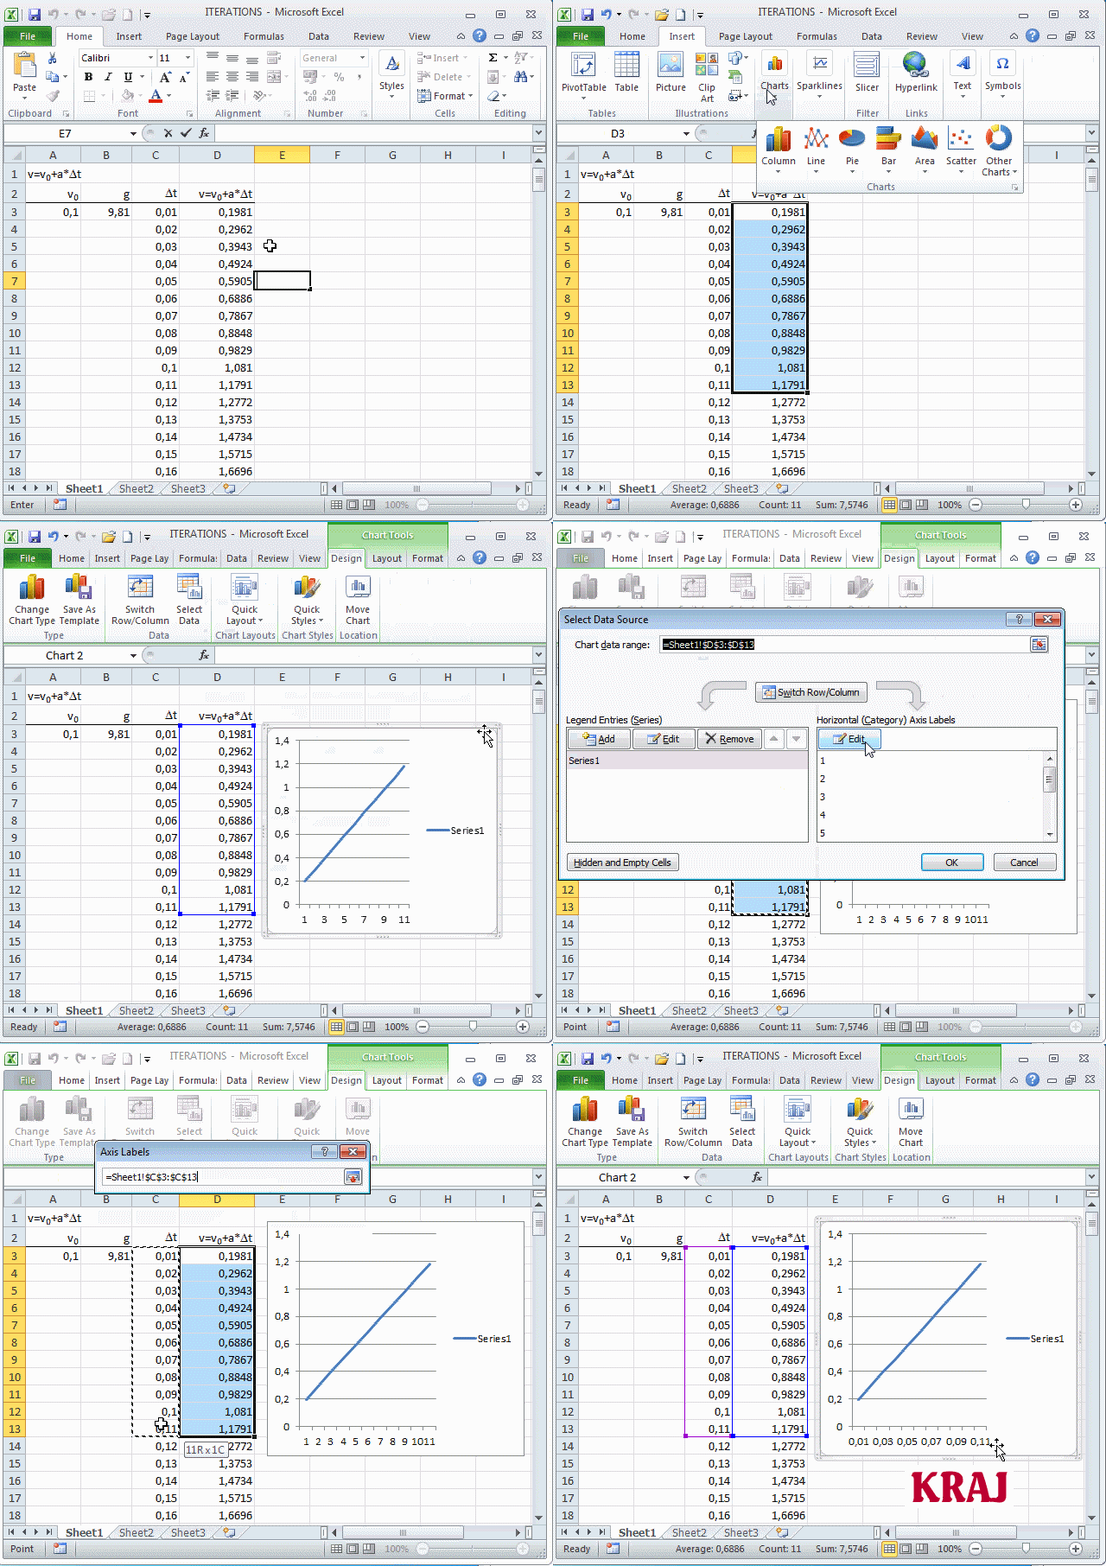
Iterations - Create a chart
Create chart of data. Data present iterations (speed):
![]()
R e m a r k: For animation is used only the first 10 values. User can do it for all values.
 |
CHART - Iterations, steps:
R e m a r k: When value of v0 is changed chart is also changed |


