abc MICROSOFT EXCEL 2010 - Speed
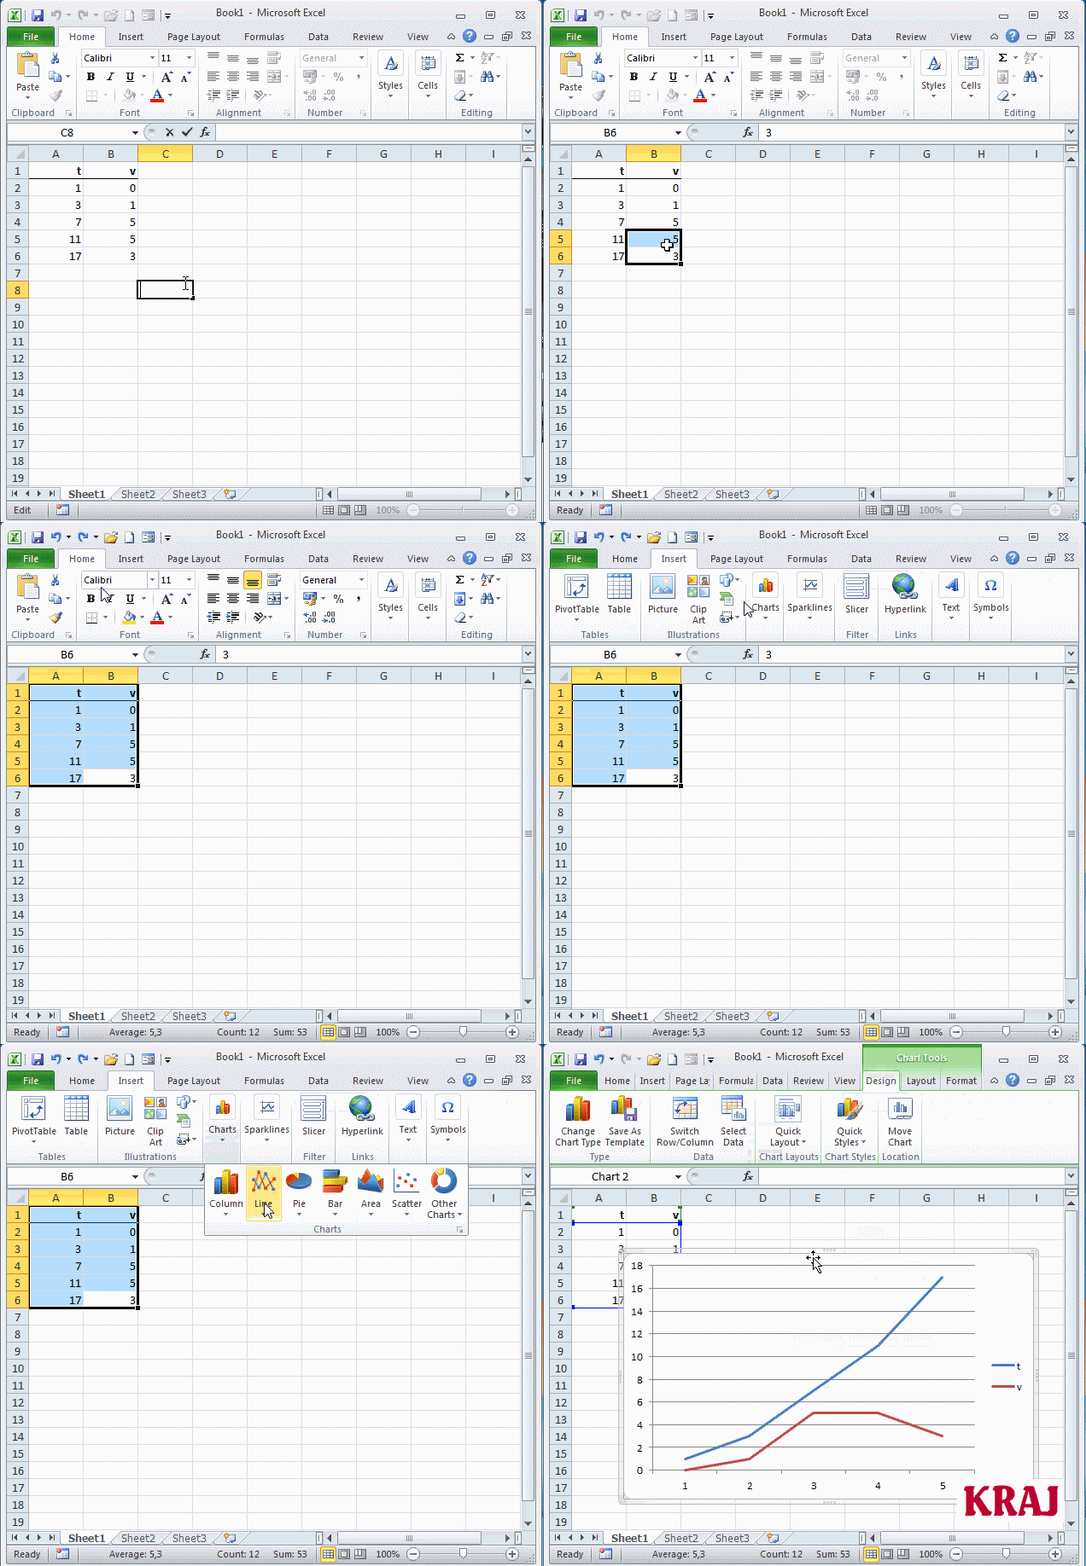
Graphics view the changes in speed
Graphics view the changes in speed according to the next table:
t |
v |
1 |
0 |
3 |
1 |
7 |
5 |
11 |
5 |
17 |
3 |
 |
Graphics view steps:
|


